

One of my big internal battles is whether model railroading is re-enactment or a game - whether I’m going to give up a bit of reality to make operations more fun, or whether I’ll sacrifice challenge and fun to make folks think about how the real trains moved. For example, do I want more timetable passenger trains to interfere with the freight trains? I chose accuracy, and model the Los Gatos commute train going to Vasona Junction and Lost Altos even though I don’t get to mess up my switching crew’s plans with another commute train to avoid. Do I model the towns as they were, or do I add fake industries or towns? Accuracy won out, though a later extension to the Moody Gulch oil fields created a single non-historic (though plausible) location. Do I do reasonable levels of freight traffic, or do I add enough work to ensure all the crews get a good workout?

Del Monte Plant #51 on the Vasona Branch layout. The two tracks are often packed with freight cars.
That question of traffic’s a big deal for me. I love model railroads that challenge me in realistic ways. When I operate, I don’t want to solve puzzles like a timesaver - I want to do work similar to what a real crew would do, and I want enough work to get into the swing of things. Switching 4 or 5 cars in one town means that the fun will end just as I’m getting familiar with the task. I want to give folks a similar experience with my model railroad - that means I want more than five or six cars to switch, I want a few places to do that switching so I can get practiced at sizing up a town, and I want the experience to last for more than 30 minutes. Most trains on my layout end up being around 10 cars, involve significant switching at multiple locations, and take around 60-90 minutes to complete. To keep traffic levels high enough to support interesting levels of switching, I operate canneries that would have been shut down or bankrupt during my time period. I pack all the sidings full of cars. I also set up the switch jobs so each job handles multiple industries. I keep people busy, even if it means not being prototypical.
That desire for a lot of switching goes against my setting - after all, I’m modeling the Santa Clara Valley in the depths of the depression. Del Monte showed it worst sales ever in the years I model. The Hyde Cannery had been dark since the late 1920’s. America wasn’t buying prunes, and co-ops paid a pittance for the fruit they took. I don’t know if crews were really switching every industry like I’m doing. And who knows if all the sidings were packed like that? I might just have a guilty conscience, but I’ve always assumed my layout is modeling insanely unrealistic levels of traffic.
But let’s back up a second. How do I know that railroad traffic wasn’t as busy as I think? There’s three questions I have to answer to understand traffic levels: knowing which industries were open, how crews switched those industries, and levels of traffic. The first question’s relatively easy - we can check newspaper and other historical documents to guess at what businesses were operating. The second’s a bit harder: we can talk with old-timers, or we can ask how switching was done in later years and assume that railroad practices didn’t change much between 1950 and 1930.
And then there’s that final question - do we know how much traffic industries generated? Do we know how many cars per month were received by a particular industry? Do we know how many boxcars were sitting on a siding? There are sources out there; they take a bit of work, but it’s possible.
For traffic levels, sometimes we can find either switchlists, railroad reports on traffic, or government groups. Angelo Figone’s book on the Northwestern Pacific, for example, tabulates the number of loads generated in each lumber town along the Eel River. Tom Campbell found a California Railroad Commission document listing the exact cars being switched at a Sacramento grocery distributor in the 1930’s. If we’re lucky, we can find photos of particular industries - though that just gives us one day, and usually only one spur.
A while back, I also found some high-resolution aerial photos of the San Jose area. At first, I looked at them only for the existence and shape of buildings, but then I realized the photos also captured the freight cars at each industry. So let’s run through them and decide on typical traffic during the 1930’s.
I’ll look at several photos.
- 1920’s overview of Del Monte Cannery #3, taken high enough to capture some other industries. (History San Jose collection.)
- Aerial photos taken in March 1931 by Fairchild Aerial Surveys (San Jose Public Library collection - see images 12, 22, 31.)
- Aerial photos, with a code of 5900 on the image, appears to be from the late 1930’s - after the Market Street station had been torn down. (See image 5900-56; I didn't record the source of the image.)
- Aerial photos from July 1939, captured by a contractor for the U.S. Department of Agriculture. (U.C. Santa Cruz collection, see images 284-107, 284-106.)
- The fourth is a photo of the San Jose College Park yard in 1940. It’s at an oblique angle so we can’t see all the spurs, but we’ll get an idea about traffic. San Jose Library collection.
These images don’t necessarily say much about 1933, but they do give us several data points for the 1930’s in general.
The full tabulation is in a spreadsheet linked at the bottom of the post, but there’s the good parts.
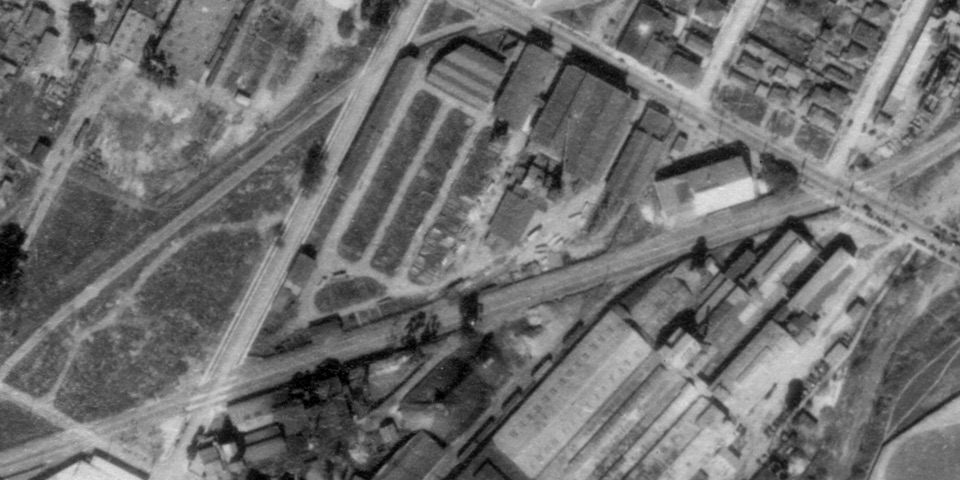
Photo of Del Monte Plant #3, 1931.
Overall, the number of freight cars is higher than I expected - I expected a lot of empty freight docks, but most of the known-active businesses had their spurs packed with freight cars. Del Monte Plant #3, and the Security Warehouse and Cold Storage plant on First Street, the Richmond Chase cannery on Stockton Ave all were packed with cars. Del Monte Plant #51 wasn’t always full, but certainly had activity. Even lesser industries: J. S. Roberts dried fruit packing house on San Carlos St, or the PG&E generating plant south of Diridon Station - always had at least one car around.
The exceptions were the industries that probably weren’t in action. There’s no sign of cars at the former Hunts / Richmond Chase cannery on Fourth Street. That could just be that the buildings make it harder to spot cars, but it also represented an older canning plant that might not have run regularly. J. S. Roberts shows no cars in 1939, suggesting the building may not have been in use. The lumberyard at Sunol and San Carlos seems to be in active use through the 1930’s, but I’m not seeing many cars there at all.
And regardless of businesses, team tracks and freight houses were constantly packed. Both the San Jose freight depot (off San Pedro Street) and team track off the Alameda (next to the PG&E gas holder) both were constantly packed with cars. Even the Union Ice icing decks on San Fernando St. (for the WP) and the one on Stockton Ave. (for the SP) were suitably busy. The 1931 photo even captures a 60 car train threading its way around Diridon Station; I’d make a guess at the locomotive, but it’s hidden under a cloud of black smoke.
The photos also hint at other kinds of activity. The photos of the railroad yards off of San Pedro St. show declining usage through the 1930’s, with the College Park yard (on the west side of the Guadalupe River) continuing to stay busy. We also see that the Security Warehouse and Cold Storage plant on First Street continued to get traffic even as the track leading to it - the former line down Fourth Street - got pulled up. All the cars there needed to be pulled back along the one block section between Second and Third streets - an awkward move for a busy business.
Even if these businesses were very active in 1931 or 1939, that still doesn’t say anything about 1933 - about when I model. But as accurate as I’m trying to be, I’m not trying to capture a particular month or a year. I’d always intended to model some time in the early 1930’s, but focused on 1933 just because I needed the choice for a few bits of scenery. The overpass over the Alameda, the raised embankment for Diridon Station, and the hints about the new main line all required choosing a later year, but I’m perfectly fine with setting my traffic in 1930 and my scenery in 1933 if it tells a big story. As much as the Valley’s suffering during the depression tells an important story, I’d rather keep my crews busy.
So, yes, it looks like it’s quite reasonable to assume that pack all my spurs with freight cars, and force my switch crews to move all those cars. It might not be accurate for 1933, but it’s accurate for 1931, or 1936, or 1939… and I’ve got the photos to prove it.
The full list of observed cars is in a Google Docs spreadsheet. Thanks to U.C. Santa Cruz, San Jose Library, and History San Jose for sharing the aerial photos used for the data gathering.
Great analysis. Reviewing aerial photographs, like maps, are very insightful. Glad to see the museum's online images are helping your quest. Ken
ReplyDelete